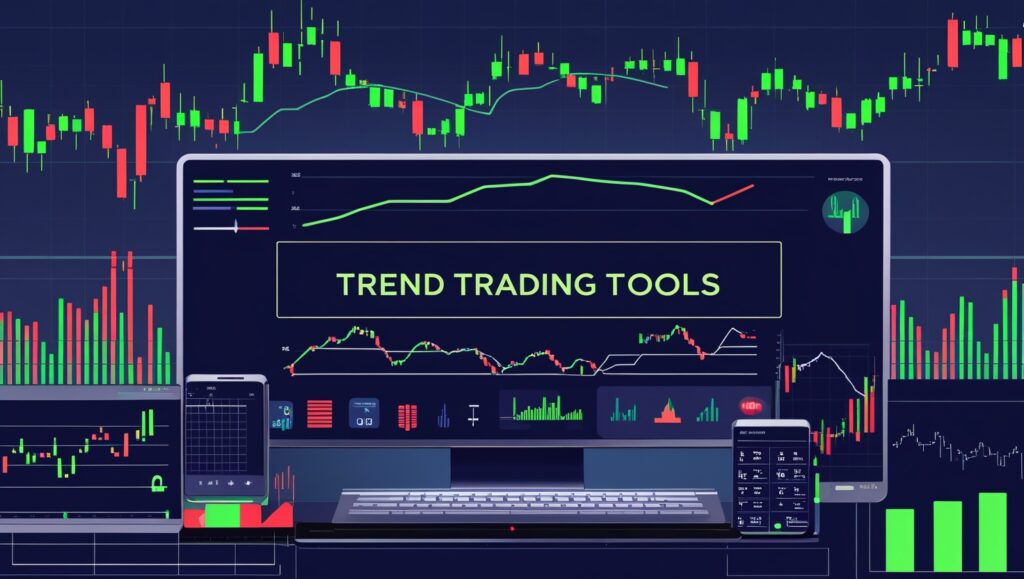
Trend trading is a strategy that focuses on capturing an asset’s directional momentum, often summed up by the adage “the trend is your friend.” According to expert Adam Hayes, “Trend trading is a strategy that seeks to capitalize on an asset’s directional momentum without trying to predict precise peaks and valleys”. This approach relies on following uptrends or downtrends as they develop, rather than guessing market tops or bottoms. In practice, successful trend traders need fast execution, robust charting tools, and risk-management features from their broker. Many platforms even offer specialized trend trading calculators or signal tools to gauge position sizes or trend strength. It is important to note that while no broker can guarantee profits, the right platform can provide the data, indicators, and stability needed to execute trend-based strategies effectively.
Overview: 5 Best Brokers offering the Best Trend Trading in the USA
| Broker | Platform & Tools | Fees & Commissions | Key Strengths & Target Audience |
|---|---|---|---|
| TOP 5 TREND TRADING BROKERS | |||
| Interactive Brokers (IBKR) PRO | • IBKR Desktop (TWS) • IBKR Mobile • Client Portal • Advanced charting tools |
$0 stock/ETF trades (Lite) Low per-share fees (Pro) |
Global market access (19,000+ symbols), institutional-grade platform, extensive research. Best for experienced traders |
| Charles Schwab (thinkorswim) BALANCED | • thinkorswim desktop/web • Schwab Mobile • Hundreds of indicators • Level II data |
$0 stocks/ETFs $0.65 per options contract |
Advanced charting, rich educational content, comprehensive research, excellent customer support. Great all-around choice |
| Fidelity Investments BALANCED | • Active Trader Pro (desktop) • Fidelity mobile app • Customizable charts • Research screeners |
$0 stocks/ETFs $0.65 per options contract |
Strong research and screening tools, user-friendly interface, extensive educational resources. Perfect for retirement + trading combo |
| TradeStation PRO | • TradeStation Desktop • Web Trading, Mobile • EasyLanguage coding • Robust backtesting |
$0 stocks/ETFs $0 futures options $500 min account |
Professional-grade charting, custom strategy development, active trader community. Gold standard for active traders |
| FOREX.com SPECIALIST | • Proprietary web platform • MetaTrader 4/5 • Advanced forex charts • Global market data |
No stock trading FX spreads: 0.8-1 pip EUR/USD |
Specialized forex broker, tight spreads, sophisticated currency trading tools. Best for forex trend traders only |
| ESSENTIAL TREND TRADING INSIGHTS | |||
| Core Strategy | Follow directional momentum using “the trend is your friend” principle. Focus on higher highs/lows (uptrend) or lower highs/lows (downtrend) | ||
| Key Tools | Moving Averages (MA), MACD, RSI, trend lines, volume indicators, and position sizing calculators | ||
| Time Frames | Focus on daily, weekly, or monthly charts for dominant trends. Use longer-term perspective to filter out market noise | ||
| Risk Management | Use stop-loss orders, position sizing calculators, and risk controls. Never risk more than a set percentage of capital | ||
| Platform Selection | Choose based on experience level: IBKR/TradeStation for pros, Schwab/Fidelity for balanced approach, FOREX.com for currency specialists | ||
Trend Trading Basics: Uptrends, Downtrends, and Trend Lines
Trend trading depends on correctly identifying market direction. An uptrend is marked by a series of higher highs and higher lows, while a downtrend shows lower highs and lower lows. A sideways or range-bound market has prices moving horizontally between support and resistance. Key patterns include:
- Uptrend: Asset prices consistently make higher peaks and troughs, creating a rising trend line (support) beneath them.
- Downtrend: Successive peaks and troughs slope downward; a trend line drawn over descending highs indicates resistance. As Investopedia explains, if a price falls from $35 down to $25, “the trendline has a negative slope and the analyst should sell in the direction of the trend”. This illustrates a classic downtrend pattern.
- Trend Line: A straight line connecting pivot highs or lows. Hilary Allison of Investopedia notes that “trendlines are fundamental charting tools used by traders to depict the prevailing direction of an investment’s price”. Drawing these lines helps traders visualize support/resistance and gauge when a trend may be weakening.
Trend trading typically uses longer time frames. As Investopedia points out, traders often focus on “market direction over the intermediate and long-term time frames. This means looking at daily, weekly, or monthly charts to spot the dominant trend. During these trends, short-term pullbacks can occur, so traders use indicators (e.g. moving averages) to filter out noise. For example, a rising price above an ascending moving average confirms an uptrend, whereas price below a falling moving average signals a downtrend. Moving averages, MACD, and RSI are common tools that “filter market noise and signal reversals”. In practice, traders wait for these technical confirmations (such as a moving-average crossover or RSI divergence) before jumping aboard a trend.
Also, having the right tools (like drawing trend lines or using a trend trading calculator) can help quantify trend strength. Many brokers and trading platforms provide built-in calculators to set optimal stop-loss or take-profit levels based on recent price swings. For example, a position-sizing calculator might use a defined risk percentage combined with a trend’s volatility to suggest how many shares or contracts to trade. Such tools are valuable, but they complement—rather than replace—the critical task of spotting genuine trend setups.
Trend Trading Tools: Indicators and Calculators

Trend traders rely heavily on technical indicators and data. Charting platforms usually include dozens of indicators, but a few stand out for trend-following:
- Moving Averages (MA): Smooth out price data to highlight direction. A long-term MA (like 200-day) rising steadily indicates a sustained uptrend. Conversely, a downward-sloping MA flags a downtrend.
- Moving Average Convergence Divergence (MACD): Shows trend direction and momentum. A rising MACD line and histogram can confirm an uptrend’s strength, while a falling MACD suggests weakening momentum.
- Relative Strength Index (RSI): Gauges overbought/oversold levels and can signal trend continuation. For example, in a bull trend, RSI pullbacks often stay above mid-level (50), hinting that the uptrend remains intact.
- On-Balance Volume (OBV) / Volume Indicators: Used less often but can reveal if volume supports the price trend.
Brokers’ platforms typically include drawing tools for trend lines and channels, which complement indicators. It is important to note that no single tool guarantees success. Traders often use multiple confirmations. For instance, a trader might wait for price to bounce off a trend line (support) while MACD crosses bullish, then enter a long position. Also, many brokers now offer custom scanner tools: for example, a “golden cross” scanner finds every stock where the 50-day MA just crossed above the 200-day MA, a classic bullish signal.
In addition to charting, modern trend traders use calculators for risk management. A trend trading calculator might estimate potential profit given entry/exit rules, or compute position size so that a stop-loss at a trend reversal keeps risk at a set percentage of capital. While few brokers market a “trend trading calculator” by name, tools like Fibonacci retracement calculators, margin/lease calculators, or backtesting simulators serve a similar purpose in planning and validating trend strategies. These features help traders manage trades once a trend is identified and typically are bundled in the platform’s advanced tools.
Top 5 Brokers for Trend Trading in the USA
Not all brokerage platforms are equal when it comes to servicing trend traders. The best ones offer powerful charting, custom alerts, seamless execution, and extensive research. The table below summarizes five brokers known for strong trend-trading capabilities:
| Broker | Trading Platforms / Tools | Commissions / Fees | Notable Strengths |
|---|---|---|---|
| Interactive Brokers | IBKR Desktop (TWS), IBKR Mobile, Client Portal | $0 stock/ETF trades (Lite); IBKR Pro: low per-share fees | Global market access; extensive research; pro-level charting |
| Charles Schwab (thinkorswim) | thinkorswim desktop/web, Schwab Mobile | $0 stocks/ETFs; $0.65/options | Advanced charting; rich educational content; extensive research |
| Fidelity Investments | Active Trader Pro, Fidelity mobile app | $0 stocks/ETFs; $0.65/options | Strong research and screeners; low-cost, full-service brokerage |
| TradeStation | TradeStation Desktop, Web Trading, Mobile | $0 stocks/ETFs; $0 futures options | Professional-grade charting; robust strategy backtesting; active trader community |
| FOREX.com | Forex.com Web Platform, MetaTrader 4/5 | No stock trading; FX spreads (0.8–1 pip EUR/USD) | Specialized forex broker; sophisticated trading tools; global market data |
- Interactive Brokers (IBKR) – This multi-asset broker is famous among active traders. It offers IBKR Mobile and Trader Workstation with advanced charting and direct market access. Analyst Steven Hatzakis notes that IBKR provides “a modern, institutional-grade trading platform suite” along with “competitive fees and high-quality research”. NerdWallet’s Sam Taube adds that the IBKR Mobile app delivers “extensive information and customization Interactive Brokers is known for” in a relatively intuitive package. With access to over 19,000 symbols worldwide, IB is ideal for following trends across stocks, futures, forex, and more. (Its complexity and many features make it best suited to experienced traders.)
- Charles Schwab (thinkorswim) – Schwab’s thinkorswim platform is widely lauded for its charting and analysis tools. Bankrate describes Schwab as doing “everything well, from strong trading platforms and a broad array of tradable securities”. The integrated thinkorswim platform (inherited from TD Ameritrade) provides hundreds of customizable indicators and drawing tools. As SmartAsset reviews note, thinkorswim offers an “enormous range of choices” with both technical and fundamental analysis. This means trend traders can combine price patterns with news and Level II data. Schwab also includes pre-built layouts and desktop/web/mobile connectivity, all commission-free on stocks and ETFs.
- Fidelity Investments – Fidelity’s platform is another full-service option for trend traders. It provides Active Trader Pro (desktop) and web tools with customizable charts. Fidelity is noted for its extensive research and screening tools. As Bankrate reports, Fidelity “will do right by you” with a great trading platform and vast educational resources. Although often seen as retirement-focused, Fidelity also supports day and swing trading. It charges no commissions on stock/ETF trades, and offers advanced mobile charting and analytics. Many trend traders appreciate Fidelity’s balance of sophisticated tools (like real-time analytics and chart studies) and user-friendliness.
- TradeStation – TradeStation is known as a powerhouse for active traders. NerdWallet calls it “the gold standard for advanced, active traders”. It features one of the most robust charting platforms (with EasyLanguage for custom indicators/strategies) and an active community. TradeStation’s pros include commission-free trading on stocks and ETFs and industry-leading speed/execution. It offers comprehensive backtesting tools, which trend traders can use to simulate strategies. (A minor downside is a $500 account minimum, but there are no inactivity fees.) TradeStation excels at enabling custom trend-following strategies to be coded and tested, plus it provides an active forum for traders to share insights.
- FOREX.com – For those primarily trading currency trends, FOREX.com is a top choice among US-regulated forex brokers. It provides a proprietary platform with integrated charts, as well as MetaTrader 4/5 support. As the ForexBrokers.com review notes, “FOREX.com is a trusted brand that delivers an excellent trading experience…with an impressive suite of proprietary platforms”. It offers tight spreads and comprehensive charting tools (including dozens of indicators). While FOREX.com does not offer stock trading, its deep focus on forex pairs makes it a strong pick if your trend strategies center on currency movements. (OANDA is a similar alternative for forex trend traders.)
Each of these brokers brings different strengths. Interactive Brokers and TradeStation excel in advanced charting and global markets, whereas Schwab and Fidelity offer well-rounded platforms with excellent customer support and research resources. Forex.com specializes in currencies. Trends can arise in any market, so factors like available instruments and specific tools (trend-line drawing, scanners, news feeds) should guide a trader’s choice. Each broker above also supports technical indicators and automated alerts. In practice, an investor might use Schwab’s thinkorswim to analyze stock charts, IBKR for global access, and Forex.com for currency trends. It is important to note that selecting a broker is just one part of successful trend trading; discipline, sound analysis, and risk management ultimately determine results.
Conclusion
Trend trading success comes from combining strategy with the right broker tools. The five brokers above provide robust charting, data, and execution needed to implement trend-based strategies in the US markets. Conclusively, advanced traders might gravitate to Interactive Brokers or TradeStation for their power and flexibility, while others may prefer Schwab or Fidelity for comprehensive support and ease of use. Regardless of choice, traders should always use risk controls (such as stop-loss orders) and remain cautious in volatile markets. Continuous learning—drawing trend lines accurately, using calculators wisely, and heeding market news—is essential. As has been discussed earlier, markets can change behavior, so staying adaptable while following the core trend-trading principles (ride trends until signs of reversal) is key. Ultimately, traders are encouraged to try demo accounts or paper-trade first to get comfortable with each platform’s features. Armed with the right broker and a disciplined approach, traders can better position themselves to capitalize on market trends moving forward.
FAQ
What is trend trading in forex?
Trend trading in forex is a strategy where traders attempt to capture directional price movements over time. It focuses on identifying uptrends or downtrends using tools like moving averages, trend lines, and momentum indicators, rather than predicting short-term fluctuations.
Which indicators are most useful for identifying a trend?
Commonly used indicators for trend trading include moving averages (such as the 50-day and 200-day), MACD, RSI, and trend lines. These tools help confirm whether a market is in an uptrend, downtrend, or moving sideways.
Do brokers provide a trend trading calculator?
While most brokers do not brand their tools as “trend trading calculators,” many offer position sizing calculators, margin calculators, and backtesting tools. These features help traders plan entries, set stop-loss levels, and estimate risk-to-reward ratios for trend strategies.
Which US-regulated brokers are best for forex trend trading?
Top choices include Interactive Brokers, Charles Schwab (thinkorswim), Fidelity Investments, TradeStation, and FOREX.com. Each platform provides advanced charting, indicators, and execution tools suitable for trend traders.
Is trend trading suitable for beginners?
Trend trading can suit beginners if approached with discipline and risk management. Using demo accounts, learning to draw accurate trend lines, and applying stop-losses are essential steps before trading with real capital.


